Steps to check web statistics in Plesk
It is essential to check the bandwidth and disk space using a web analytic tool. We would recommend you to choose either AWStats or SmarterStats. To view the website statistics, one can use both the tools without hesitation. You have two choices but select any one tool for website statistics view point.
Let us learn how to view website statistics with the tool in your choice:
Step 1: Enter your username and password to login in control panel of Plesk. Select the choice “Websites & Domains”.
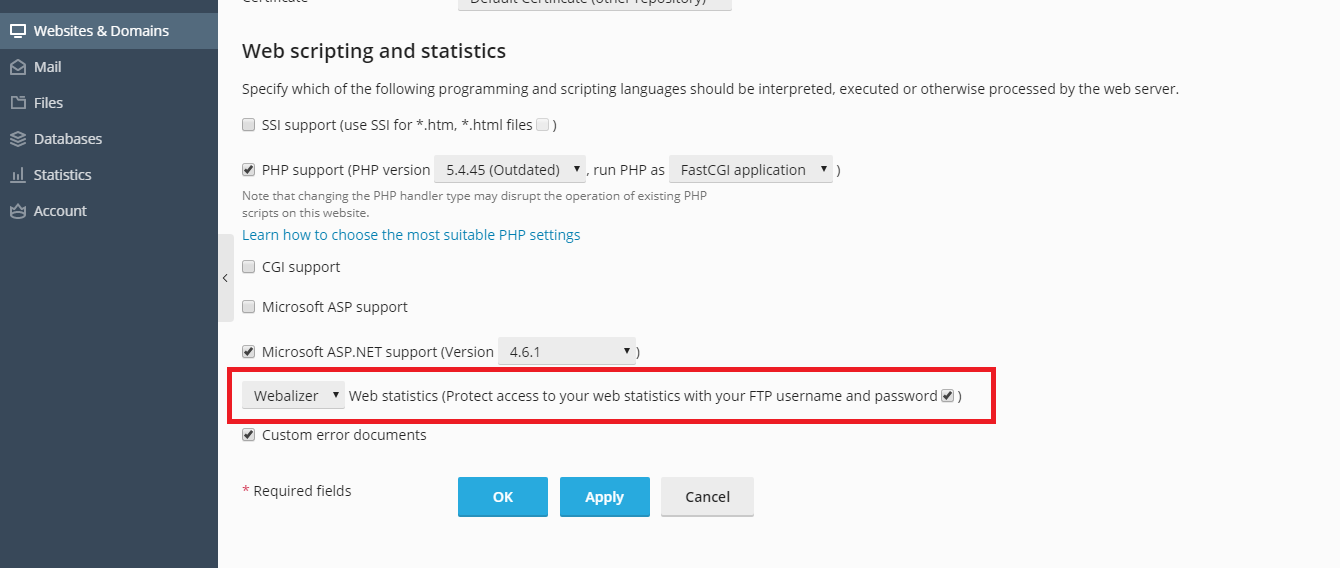
Step 2: After clicking it, tap on Hosting Settings to select the tool under Website Statistics. At last, tap on save changes button.
AWStats:
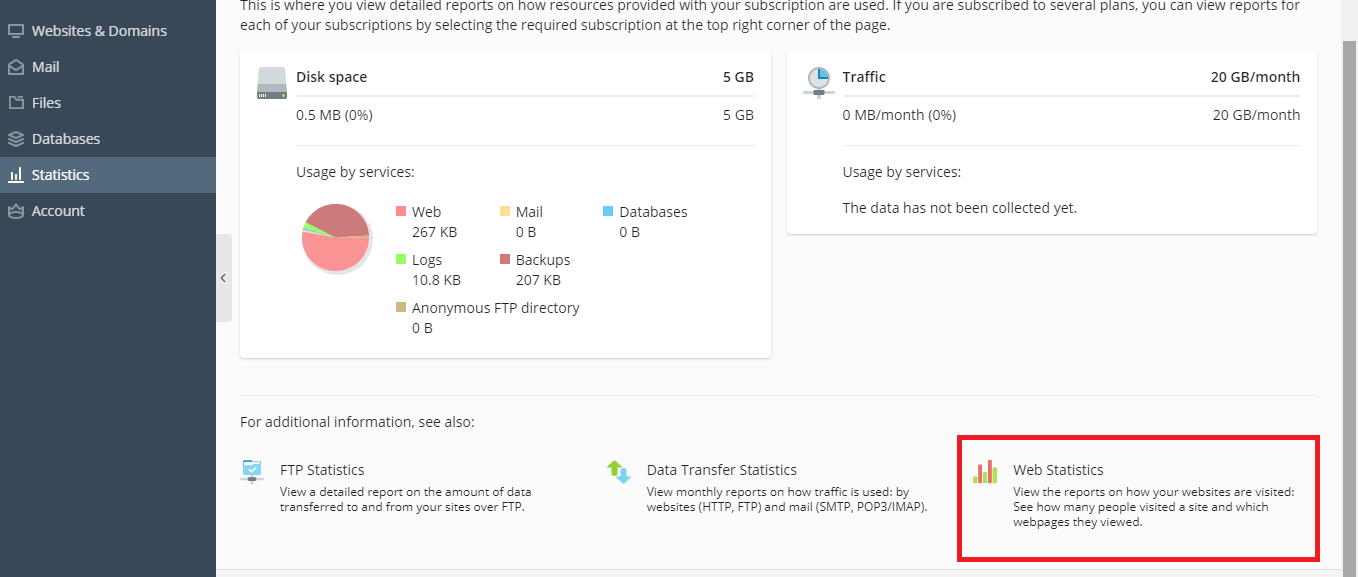
Step 1: In Plesk control panel, select the Statistics and then go to Website Statistics.
Step 2: In website statistics, tap on View button. Moreover, you need a report isn’t it? Then select the month & year for getting report monthly without fail.
When: Hours, Days of week, days of month and monthly history.
Who: Last visit, robots visitor, unresolved IP address, Hosts and countries.
Navigation: Unknown, versions, browsers, OS, viewed, entry, file type, visit duration.
Referrers: Search keyword, search key phrases, search, referring sites, referring search engines and origin.
Others: Error hits (404), Error hits (403), error hits (400), HTTP status codes and miscellaneous.
SmarterStats:
Step 1: Plesk control panel > statistics > Web statistics > View
Step 2: You will be redirecting with new window with below options such as:
Site activity: Traffic, files, paths, search engines, visitors and referrals.
Demographics: User agent, countries, regions and cities.
Server Health: Server response, server utilization, page utilization.
Spiders and Bots, SEO, Site tuning, Data mining
Settings: My settings, site settings and status.
It is essential to check the bandwidth and disk space using a web analytic tool. We would recommend you to choose either AWStats or SmarterStats. To view the website statistics, one can use both the tools without hesitation. You have two choices but select any one tool for website statistics view point.
Let us learn how to view website statistics with the tool in your choice:
Step 1: Enter your username and password to login in control panel of Plesk. Select the choice “Websites & Domains”.
Step 2: After clicking it, tap on Hosting Settings to select the tool under Website Statistics. At last, tap on save changes button.
AWStats:
Step 1: In Plesk control panel, select the Statistics and then go to Website Statistics.
Step 2: In website statistics, tap on View button. Moreover, you need a report isn’t it? Then select the month & year for getting report monthly without fail.
When: Hours, Days of week, days of month and monthly history.
Who: Last visit, robots visitor, unresolved IP address, Hosts and countries.
Navigation: Unknown, versions, browsers, OS, viewed, entry, file type, visit duration.
Referrers: Search keyword, search key phrases, search, referring sites, referring search engines and origin.
Others: Error hits (404), Error hits (403), error hits (400), HTTP status codes and miscellaneous.
SmarterStats:
Step 1: Plesk control panel > statistics > Web statistics > View
Step 2: You will be redirecting with new window with below options such as:
Site activity: Traffic, files, paths, search engines, visitors and referrals.
Demographics: User agent, countries, regions and cities.
Server Health: Server response, server utilization, page utilization.
Spiders and Bots, SEO, Site tuning, Data mining
Settings: My settings, site settings and status.