CPU and Concurrent connection snapshot option in cpanel
In this article, we are going to learn how to resource limit metricerror information based few steps and priorities. One common mechanism to increase stability and performance in server is to resource limit information for all instances. Sometimes, you may get queries in database and also, technical process too. In that case, using cPanel you can get all reports in detail.
Now, you would get an idea about resource limit information which might be tough to view for few users. Of course! They might be confused to catch the correct steps.
Let us see the steps directly:
Step 1: Use your login details for cPanel login. Search for the metrics option and click on that to view the options in metric section.
Step 2: The metrics section has visitors, errors, raw access, bandwidth, Awstats, metric errors and CPU & concurrent connection usage.

Step 3: From that listing select the option “cpu & concurrent connection usage”.
Step 4: Into the page of cpu & concurrent connection usage, you have resource usage overview.
24 hours no issues: No limitations have triggered within 24 hours.
24 hours website resource limitation processed: You would have received one resource limitation and so, cPanel picks up exact resource report.
Resource limit hit reached: This shows the risk option if this reaching you near. cPanel gives you a message which resource is at risk to trigger.
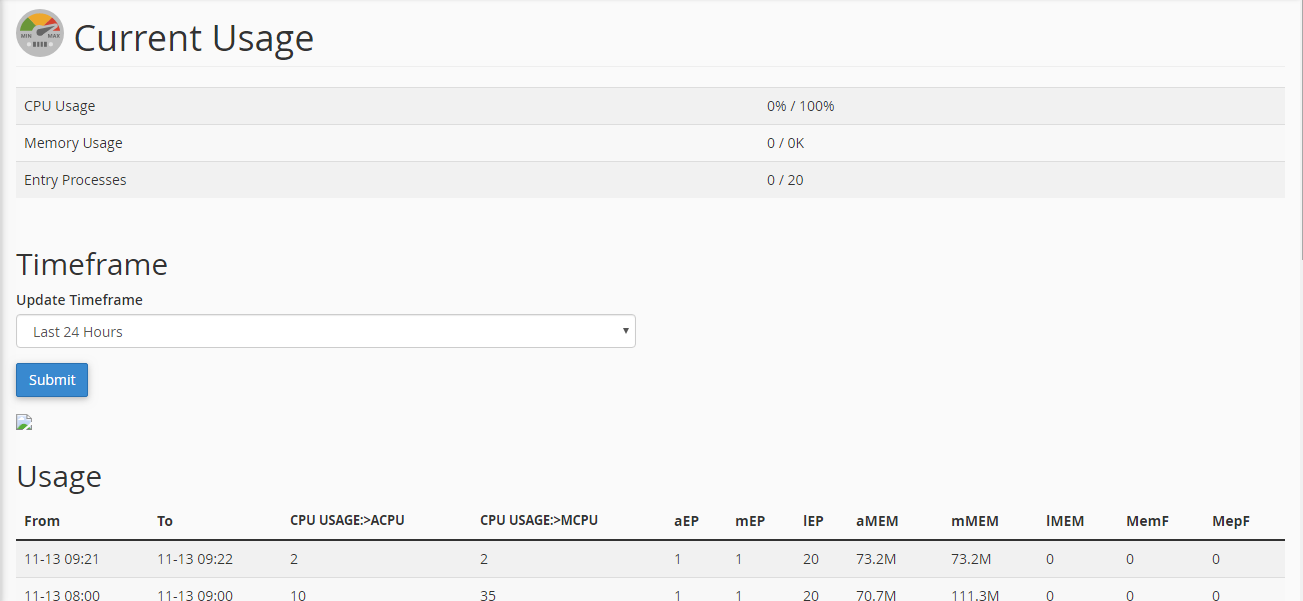
Step 5: To see the resource limit details click on detail option in cPanel. It shows the report in table format and graph representation.

The default option will be displayed as per 24 hours calculation. You can change the time limit by clicking timeframe option and then tap on submit.

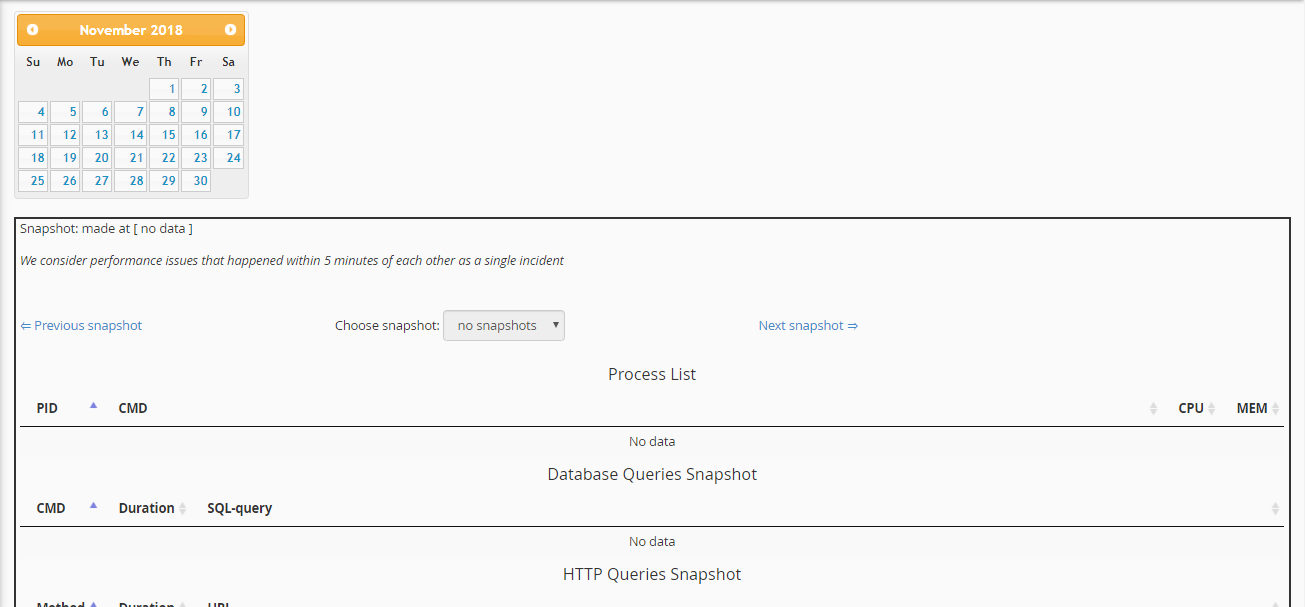
Step 6: Users can take snapshot by clicking snapshot option. According to your choice, click time and period as per your choice. Here, you can select the time and date simultaneously it takes the snapshot.

You can pick the next and previous snapshot by clicking the choice.
In this article, we are going to learn how to resource limit metricerror information based few steps and priorities. One common mechanism to increase stability and performance in server is to resource limit information for all instances. Sometimes, you may get queries in database and also, technical process too. In that case, using cPanel you can get all reports in detail.
Now, you would get an idea about resource limit information which might be tough to view for few users. Of course! They might be confused to catch the correct steps.
Let us see the steps directly:
Step 1: Use your login details for cPanel login. Search for the metrics option and click on that to view the options in metric section.
Step 2: The metrics section has visitors, errors, raw access, bandwidth, Awstats, metric errors and CPU & concurrent connection usage.
Step 3: From that listing select the option “cpu & concurrent connection usage”.
Step 4: Into the page of cpu & concurrent connection usage, you have resource usage overview.
24 hours no issues: No limitations have triggered within 24 hours.
24 hours website resource limitation processed: You would have received one resource limitation and so, cPanel picks up exact resource report.
Resource limit hit reached: This shows the risk option if this reaching you near. cPanel gives you a message which resource is at risk to trigger.
Step 5: To see the resource limit details click on detail option in cPanel. It shows the report in table format and graph representation.
The default option will be displayed as per 24 hours calculation. You can change the time limit by clicking timeframe option and then tap on submit.
Step 6: Users can take snapshot by clicking snapshot option. According to your choice, click time and period as per your choice. Here, you can select the time and date simultaneously it takes the snapshot.
You can pick the next and previous snapshot by clicking the choice.
