A complete guide of Linux Top command
Linux Top Command:
Linux Top command is an interactive utility which displays the character-based screen of all processes that runs on the current system. Screen content can be sorted by characteristics like CPU usage and memory usage. The top command allows the user to monitor the processes and system usage on Linux. It is one of the important tool in sysadmin’s toolbox, and it will be pre-installed in each distribution.
Starting Top Command:
Top command is used for managing and monitoring processes on the Linux system.
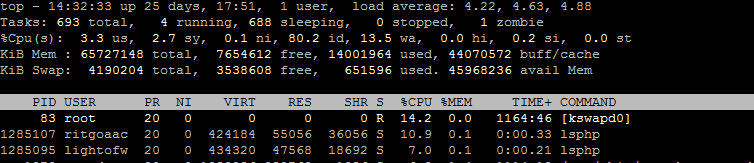
The Top command starts with command line application. The upper part of the output contains information about the processes and resource usage and the lower part contains the list of running process that is running currently.
To start the command just type the above command. Arrow keys, Page Up/Down keys are used to read through the list. “q” is used to quit. After typing this command you will get the below screen:
You can check the library version with top -v. This is a common variant of top that comes with the “procps-ng” package. The output will be
procps-ng version 3.3.10
Also to check complete command path with argument you can use below command:
First Row of TOP command:
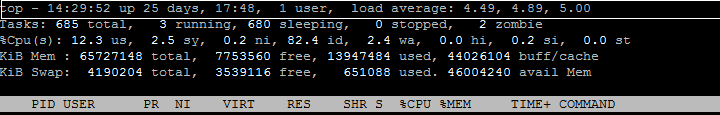
First row is about the current time, server uptime, logged in users, and CPU load. With top command you will get the below output, let’s understand the first row:
This row shows the total number of process that are running on the server. Let’s take a look of them:
Third Row of TOP command:
This row shows how much CPU is used by server, it shows the proper CPU utilization of server, so that we can check how much CPU is free. All the values are show in percentage. Let’s understand the CPU utilization values.
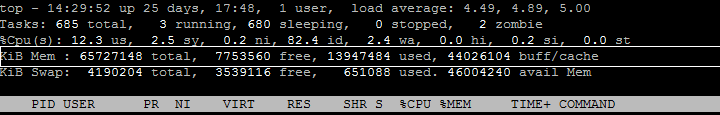
This row defines the information about the RAM usage. In this row you can check the free memory, used memory and buffer cache.
Fifth Row of TOP command:
In this row you can check the swap memory utilization, you can easily check the the server’s swap memory result.
Sixth Row of TOP command:
In this row you can check all the running processes with user details. With TOP command you can check the complete path of command.

Top command is very helpful for managing and monitoring all the processes on Linux server. With this command you can check the excessive load of server, particular user who consume resources, especially if you are admin of shared server then you can easily check all the users process and check why the server is getting slow. To know the examples of TOP command you can also check another article “TOP Command Examples in Linux”
Linux Top Command:
Linux Top command is an interactive utility which displays the character-based screen of all processes that runs on the current system. Screen content can be sorted by characteristics like CPU usage and memory usage. The top command allows the user to monitor the processes and system usage on Linux. It is one of the important tool in sysadmin’s toolbox, and it will be pre-installed in each distribution.
Starting Top Command:
Top command is used for managing and monitoring processes on the Linux system.
The Top command starts with command line application. The upper part of the output contains information about the processes and resource usage and the lower part contains the list of running process that is running currently.
Code:
top
Code:
top –vprocps-ng version 3.3.10
Also to check complete command path with argument you can use below command:
Code:
top cFirst row is about the current time, server uptime, logged in users, and CPU load. With top command you will get the below output, let’s understand the first row:
Code:
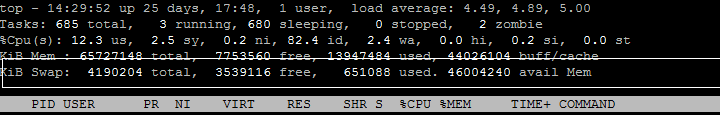
top – 14:29:52 25 days, 17:48, 1 users, load average : 4.49, 4.89, 5.00Second Row of TOP command:
This row shows the total number of process that are running on the server. Let’s take a look of them:
Zombie process: it is the process that completed execution but still has an entry in process table. This process is in ‘Terminated state’.
Total processes running on server - 685 Total
Running processes on server - 3 running
Sleeping processes on server - 680 sleeping
Stopped processes - 0 stopped
Zombie Processes on server - 2 zombie
Third Row of TOP command:
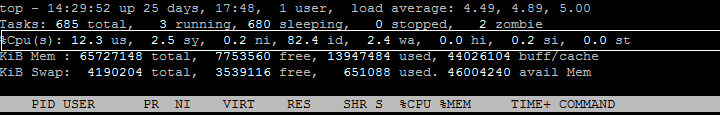
This row shows how much CPU is used by server, it shows the proper CPU utilization of server, so that we can check how much CPU is free. All the values are show in percentage. Let’s understand the CPU utilization values.
Code:
%Cpu : 12.3 us, 2.5 sy, 0.2 ni, 82.4 id, 2.4 wa, 0.0 hi, 0.2 si, 0.0 stFourth Row of TOP command:
This row defines the information about the RAM usage. In this row you can check the free memory, used memory and buffer cache.
Total is the total number of processes, running(R) state means that the process is either executing on the CPU or it is in the run queue which is ready to execute. Sleeping (D) is a state of an event or I/O waiting to complete. Stopped (T) process is stopped by job control signal. Zombie (Z) is a process that completed the execution but still has an entry in the process table.
Fifth Row of TOP command:
In this row you can check the swap memory utilization, you can easily check the the server’s swap memory result.
Memory section displays about the data regarding the memory usage of the system. Mem and Swap displays information about the spaces of RAM and Swap.
Sixth Row of TOP command:
In this row you can check all the running processes with user details. With TOP command you can check the complete path of command.
Conclusion:
Top command is very helpful for managing and monitoring all the processes on Linux server. With this command you can check the excessive load of server, particular user who consume resources, especially if you are admin of shared server then you can easily check all the users process and check why the server is getting slow. To know the examples of TOP command you can also check another article “TOP Command Examples in Linux”